- 관측 가능성 (Observability)
- 메트릭(Metric): 시스템 상태나 성능이 어떤지
- 로그(Event Logging): 무슨 일이 있었는지
- 트레이스(Tracing): 요청이 어디서 지연되거나 문제가 발생했는지
- 모니터링 (Monitoring)
- 프로파일링 (Profiling)
- 더 읽을 거리
관측 가능성 (Observability)
제어 이론에서 시스템의 내부 상태 변수와 그에 따른 행동을 시스템에 대한 입력과 출력만 보고 결정할 수 있다면 그 시스템이 관측 가능하다는 것을 나타냅니다.1
그렇다면 관측 가능성2이란 시스템의 내부 상태를 외부에서 수집 가능한 데이터(메트릭, 로그, 트레이스 등)를 통해 얼마나 잘 추론하고 이해할 수 있는지를 나타내는 시스템의 속성입니다. 즉, 시스템이 자신의 상태를 얼마나 잘 “드러내는가"를 의미합니다.
관측 가능성은 시스템의 상태를 이해하는 데 필요한 모든 정보를 제공하는 것을 목표로 합니다. 메트릭, 로그, 트레이스는 관측 가능성을 달성하기 위한 세 가지 기둥(주요 구성 요소)3입니다.
메트릭(Metric): 시스템 상태나 성능이 어떤지
메트릭은 시스템의 성능과 동작을 측정한 수치입니다. 예를 들면 CPU 사용률, 응답 시간, 오류율 등이 있습니다.
로그(Event Logging): 무슨 일이 있었는지
로그는 시스템 프로세스의 개별 이벤트를 시간 순서대로 기록하는 것입니다. 각 로그 레코드는 특정 시점에 발생한 일(예: 오류 발생, 사용자 로그인, 요청 처리 시작/종료 등)에 대한 정보를 담고 있습니다.
하지만 각 로그 스트림은 단일 인스턴스에 대해서만 알려주기 때문에 마이크로서비스에서 전체적인 모니터링을 하기에는 어려움이 있습니다.
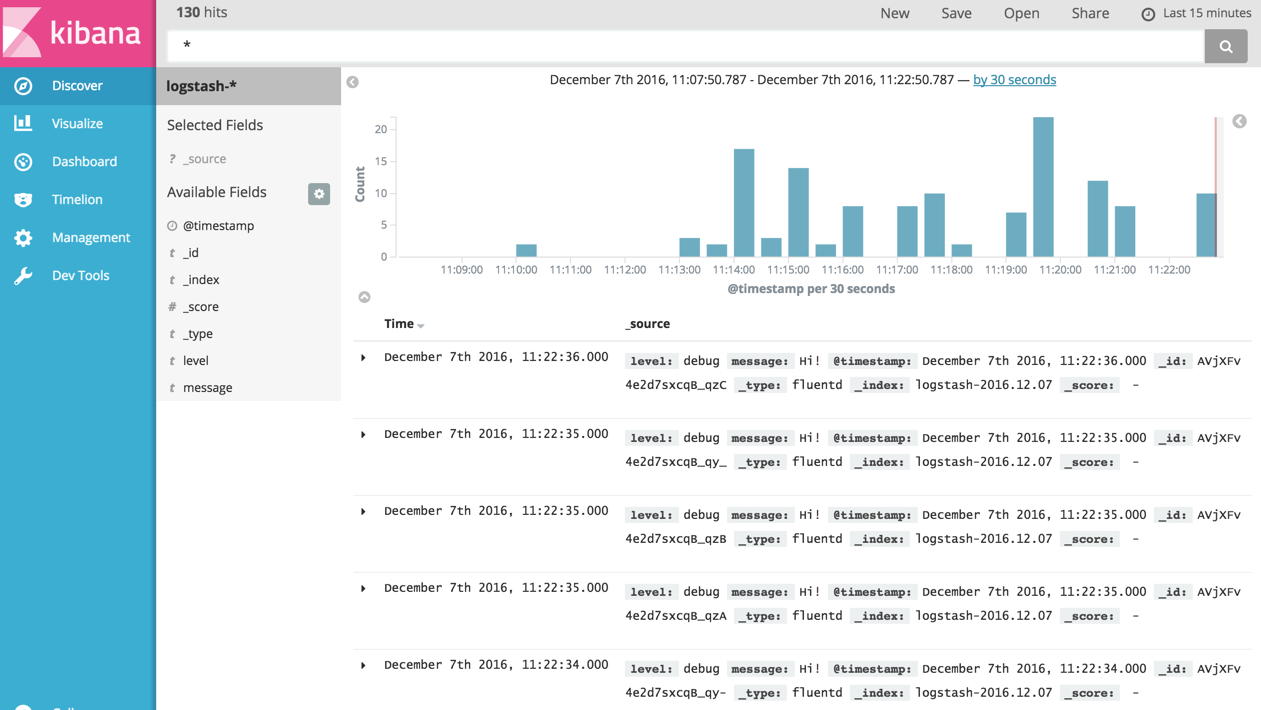 Fluentd-Kibana
트레이스(Tracing): 요청이 어디서 지연되거나 문제가 발생했는지
사용자의 트래픽이 지나가는 애플리케이션의 전체 스택을 추적합니다. 트레이싱은 구조화된 형태의 이벤트 로그라고 볼 수 있습니다. 다만 로그는 “무엇이 일어났는지"에 대한 단편적인 이벤트 정보를 제공하는 반면, 트레이스는 전체 실행 흐름을 추적하여 “무엇이 일어났는지"와 “왜 일어났는지"를 파악합니다. 예를 들어, 특정 기능에 병목이 예상되는 경우 트레이싱해서 어떤 부분인지 확인하고 최적화를 시도해볼 수 있습니다.
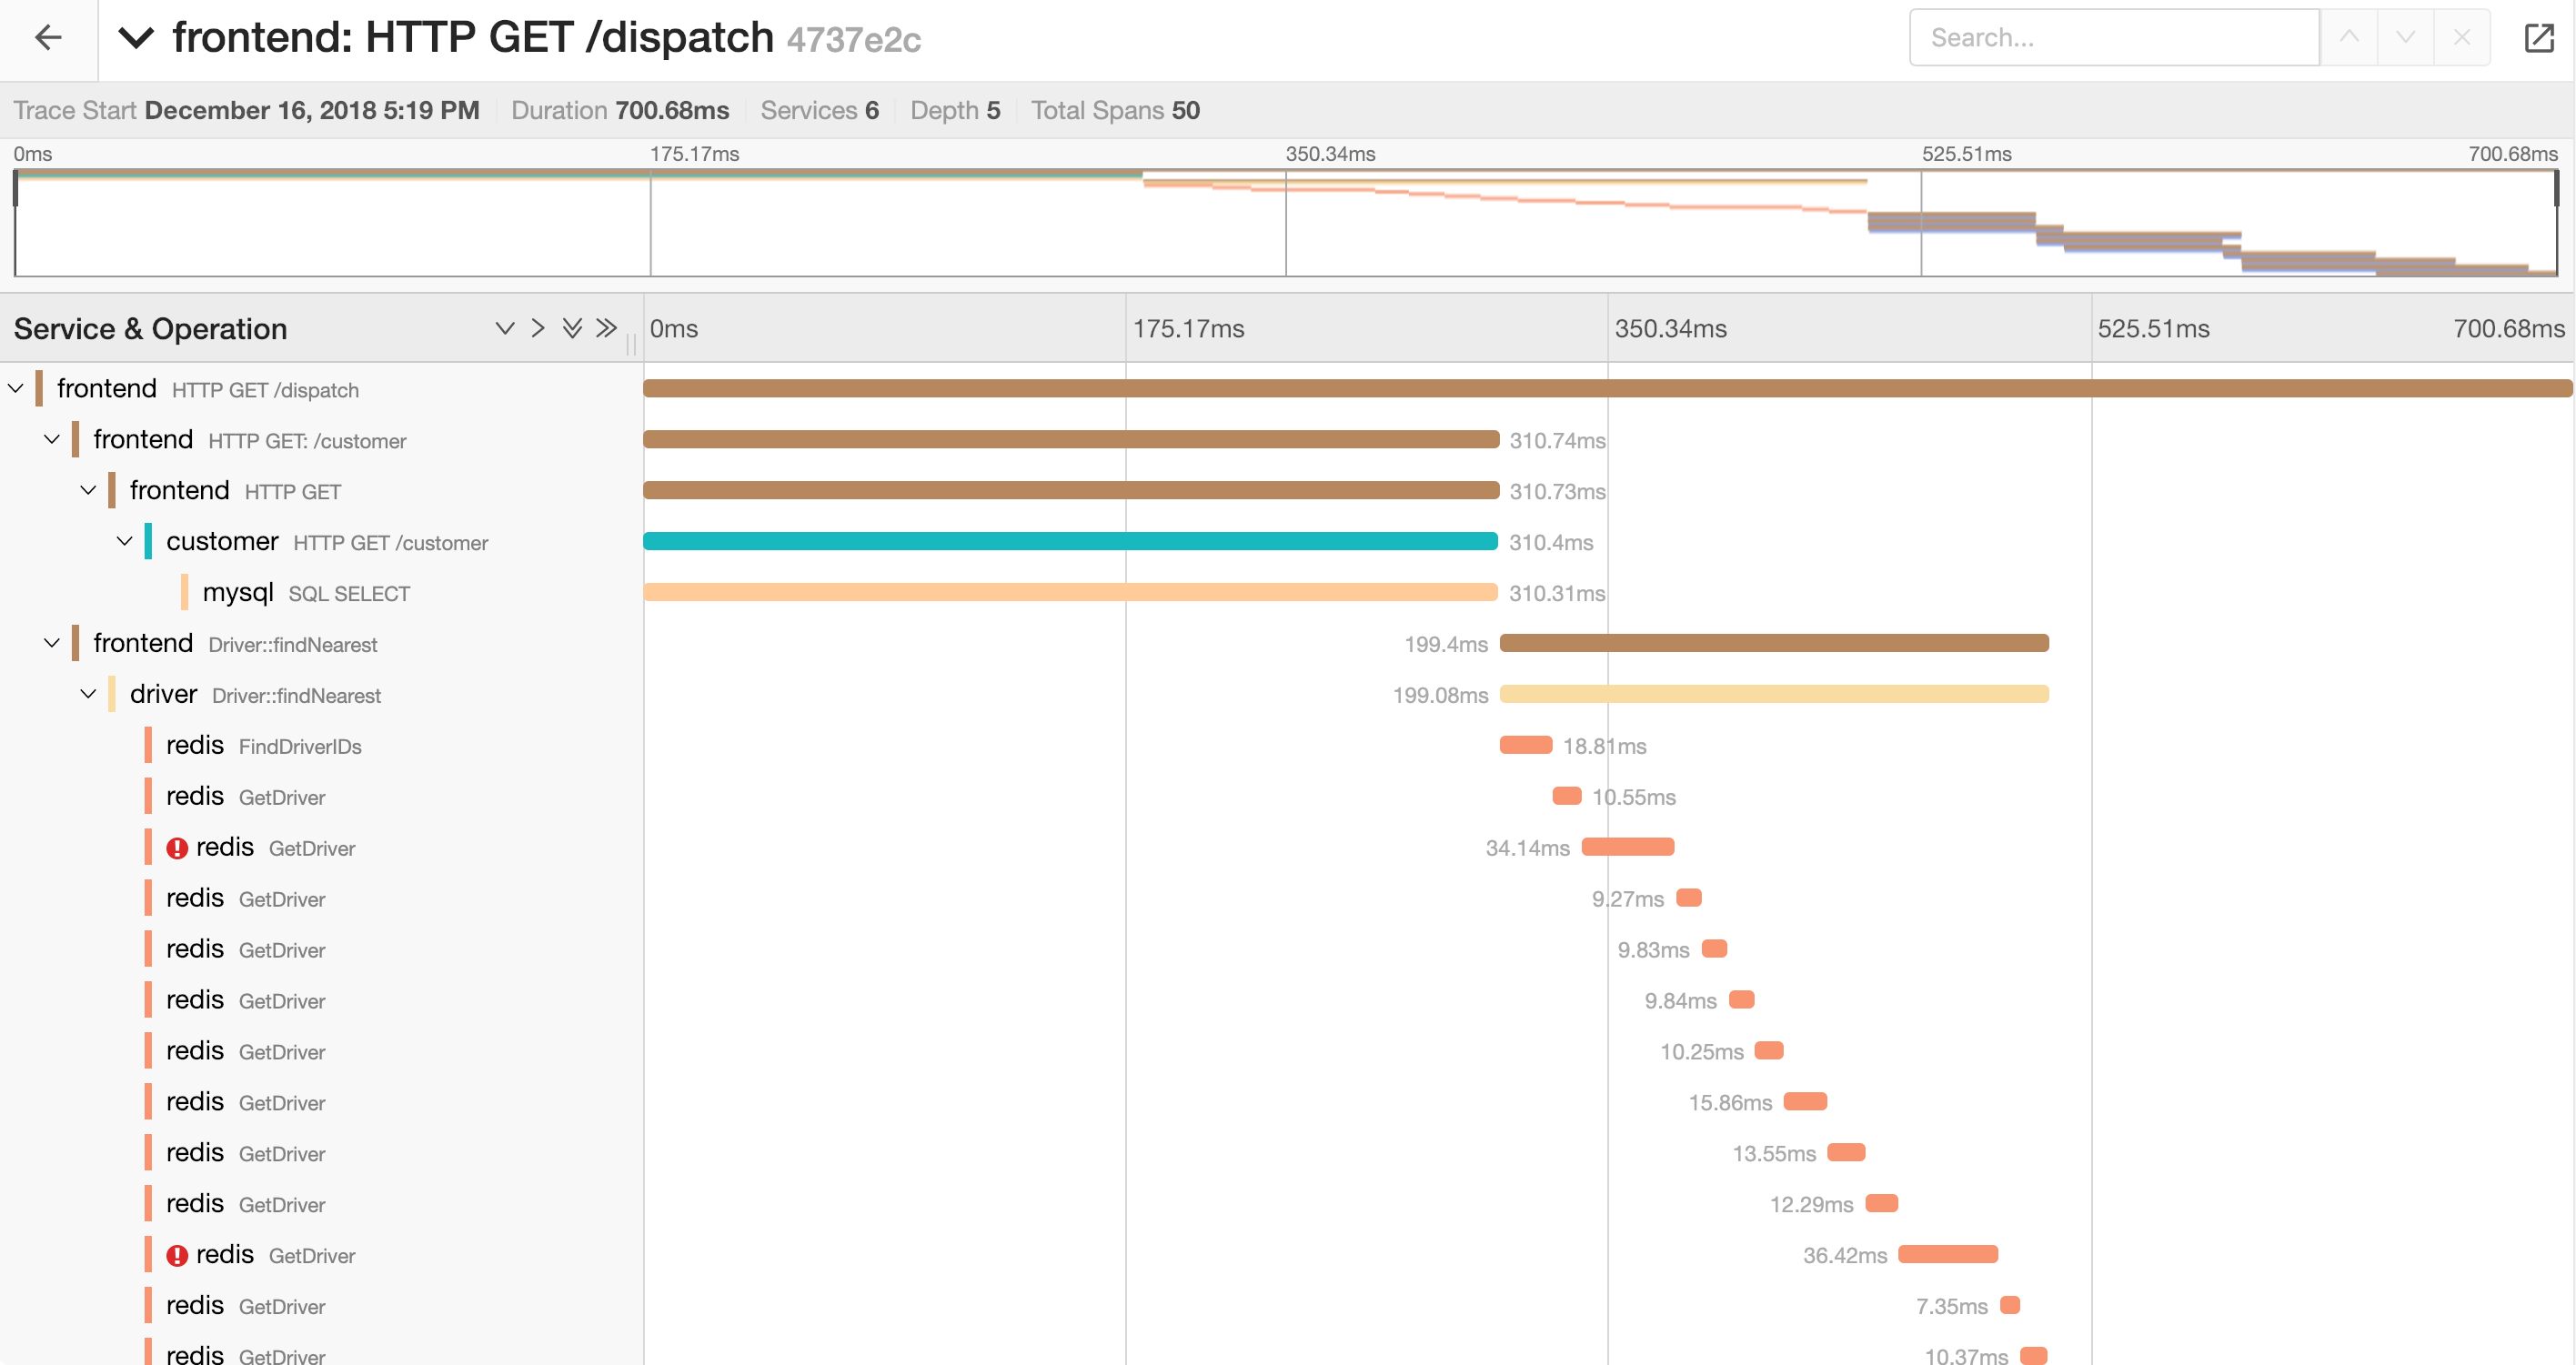 Jaeger
- Jaeger
- OpenTracing
- strace - Linux man page
- 구글 크롬의 Network log
분산 트레이싱 (Distributed tracing)
분산 트레이싱은 ‘종단 간 트레이싱’ 또는 ‘워크플로 중심 트레이싱’이라고도 불립니다. 이 기술은 하나의 요청이 여러 서비스를 거쳐 처리될 때, 그 전체 흐름과 경로를 추적하여 시각적으로 보여줍니다.
기존의 코드 프로파일러나 dtrace 같은 호스트 레벨 추적 도구와는 달리 분산 트레이싱은 여러 프로세스가 협력하는 복잡한 환경에서 개별 작업의 처리 과정을 추적하는 데 중점을 둡니다. 최신 클라우드 네이티브 마이크로서비스 애플리케이션이 바로 이러한 환경의 대표적인 예입니다.4
“Track"과 “Trace"는 모두 어떤 대상의 움직임이나 경로를 따라간다는 공통된 의미를 가지고 있지만, 그 방향성과 사용 목적에서 중요한 차이가 있습니다.5
“Track"은 시작 지점에서 현재 지점까지 앞으로 나아가는 방향으로 경로를 따라가는 것을 의미합니다. 즉, 어떤 대상이 지금 어디에 있는지를 실시간으로 관찰하고, 앞으로 어디로 향하는지를 계속해서 지켜보는 행위를 말합니다. 예를 들어, 휴대전화를 “추적한다(track)“고 하면, 이는 현재 그 전화기가 어디에 있는지를 파악하고, 앞으로 이동하는 경로를 실시간으로 따라가는 것을 뜻합니다. 이러한 “tracking"은 아직 완전히 끝나지 않은 진행 중인 경로를 따라가는 개념입니다.
반면에 “Trace"는 현재 지점에서부터 출발 지점까지 과거로 거슬러 올라가는 방향으로 경로를 따라가는 것을 의미합니다. 이미 완료된 경로를 되짚어가며, 어떤 일이 어떻게 시작되었는지를 복원하고자 할 때 사용됩니다. 예를 들어, 통화 내역을 “추적한다(trace)“고 말할 때는, 그 통화가 어디에서 시작되었는지를 조사하는 것입니다. 이는 지금 막 발생한 통화일 수도 있고, 한 달 전에 있었던 통화일 수도 있습니다. 중요한 점은, 이 경우에는 기록에 남아 있는 과거의 흔적을 바탕으로 경로를 역방향으로 따라가는 행위라는 것입니다.
모니터링 (Monitoring)
애플리케이션 계측(measure), 메트릭 수집(collect), 집계(aggregate), 분석(analyze) 등을 포함하는 시스템입니다. 진단 목적으로 가장 많이 사용되고, 문제가 발생했을 경우 관리자에게 알림을 보냅니다. 예를 들어 설정한 임계점(threshold)을 넘을 경우 이메일을 보내거나 슬랙 채널에 메시지를 보낼 수 있습니다.
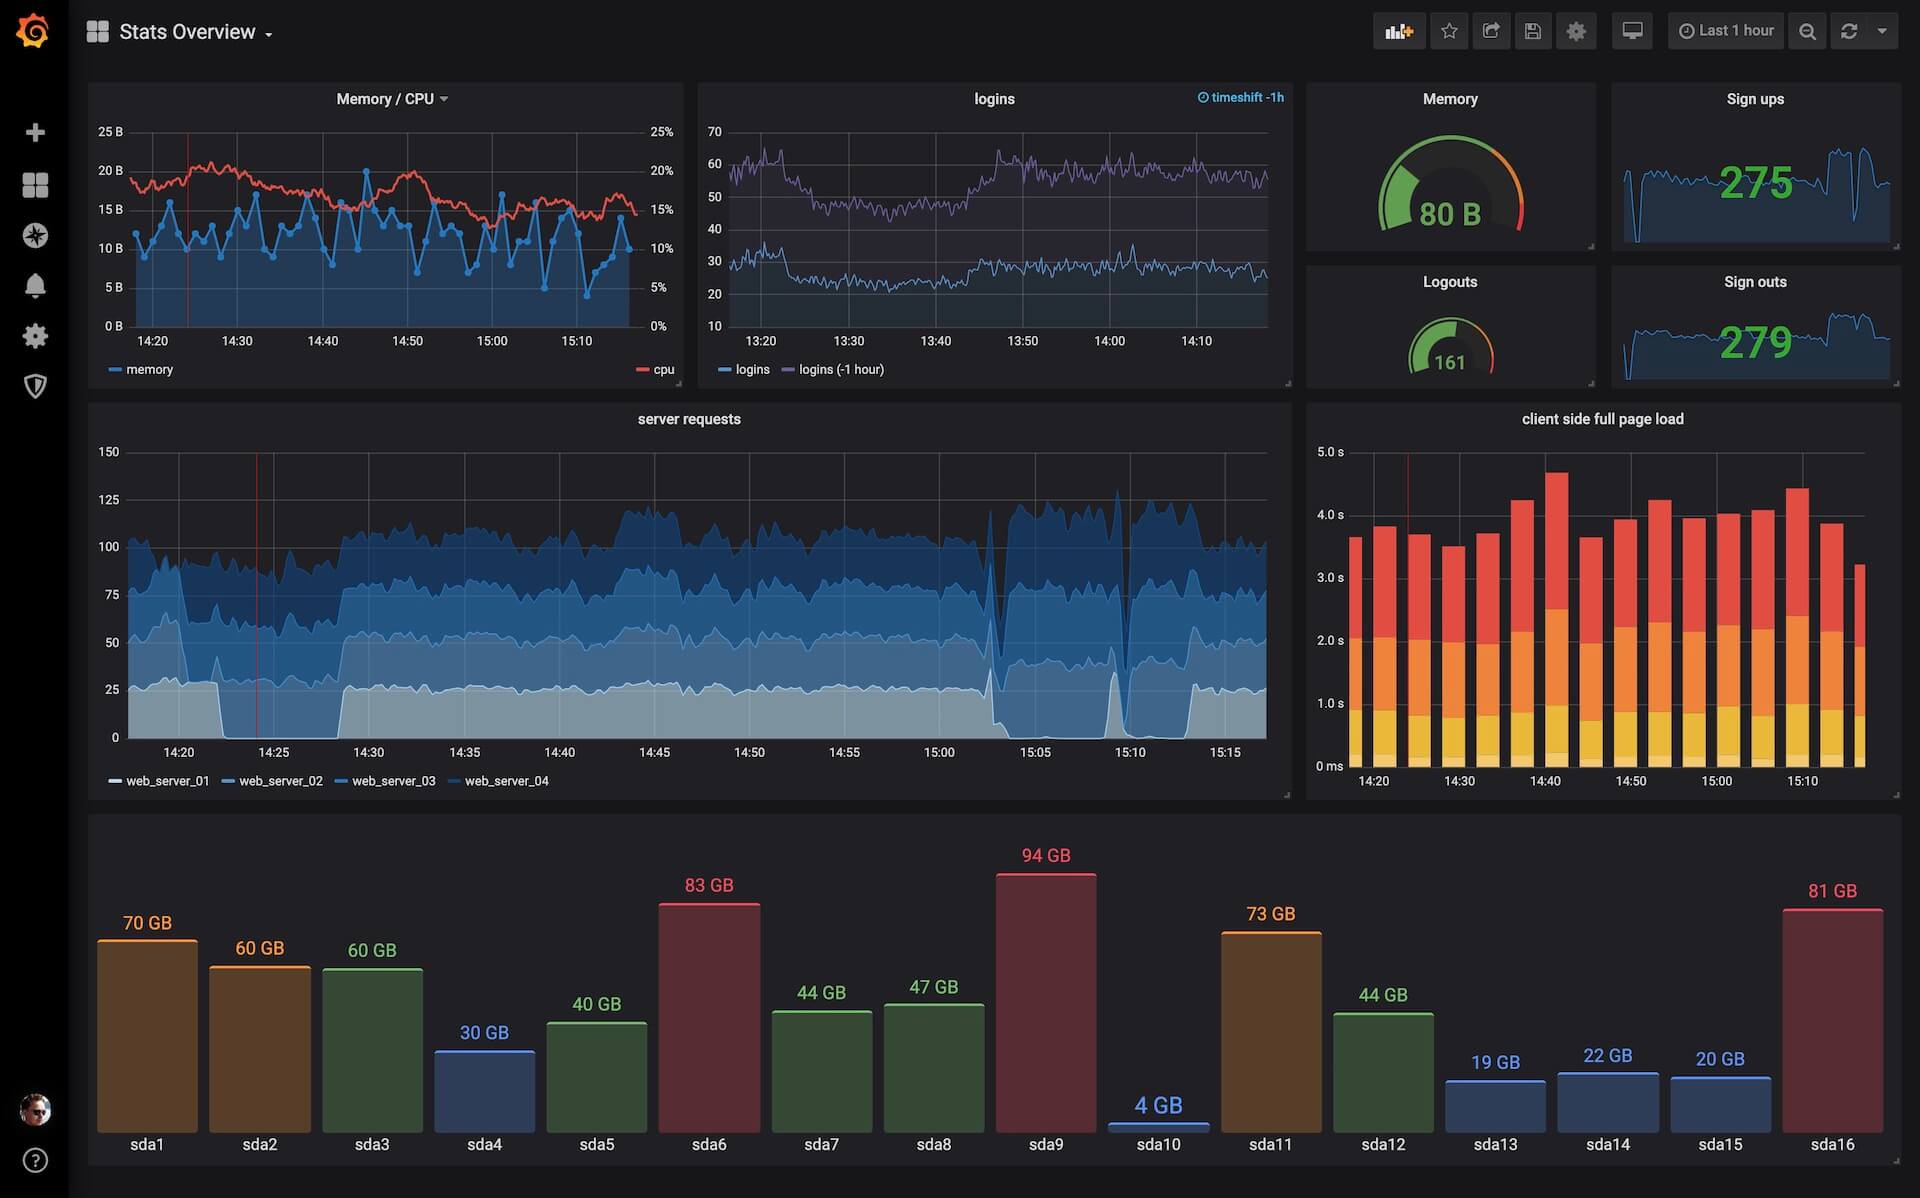 Grafana
프로파일링 (Profiling)
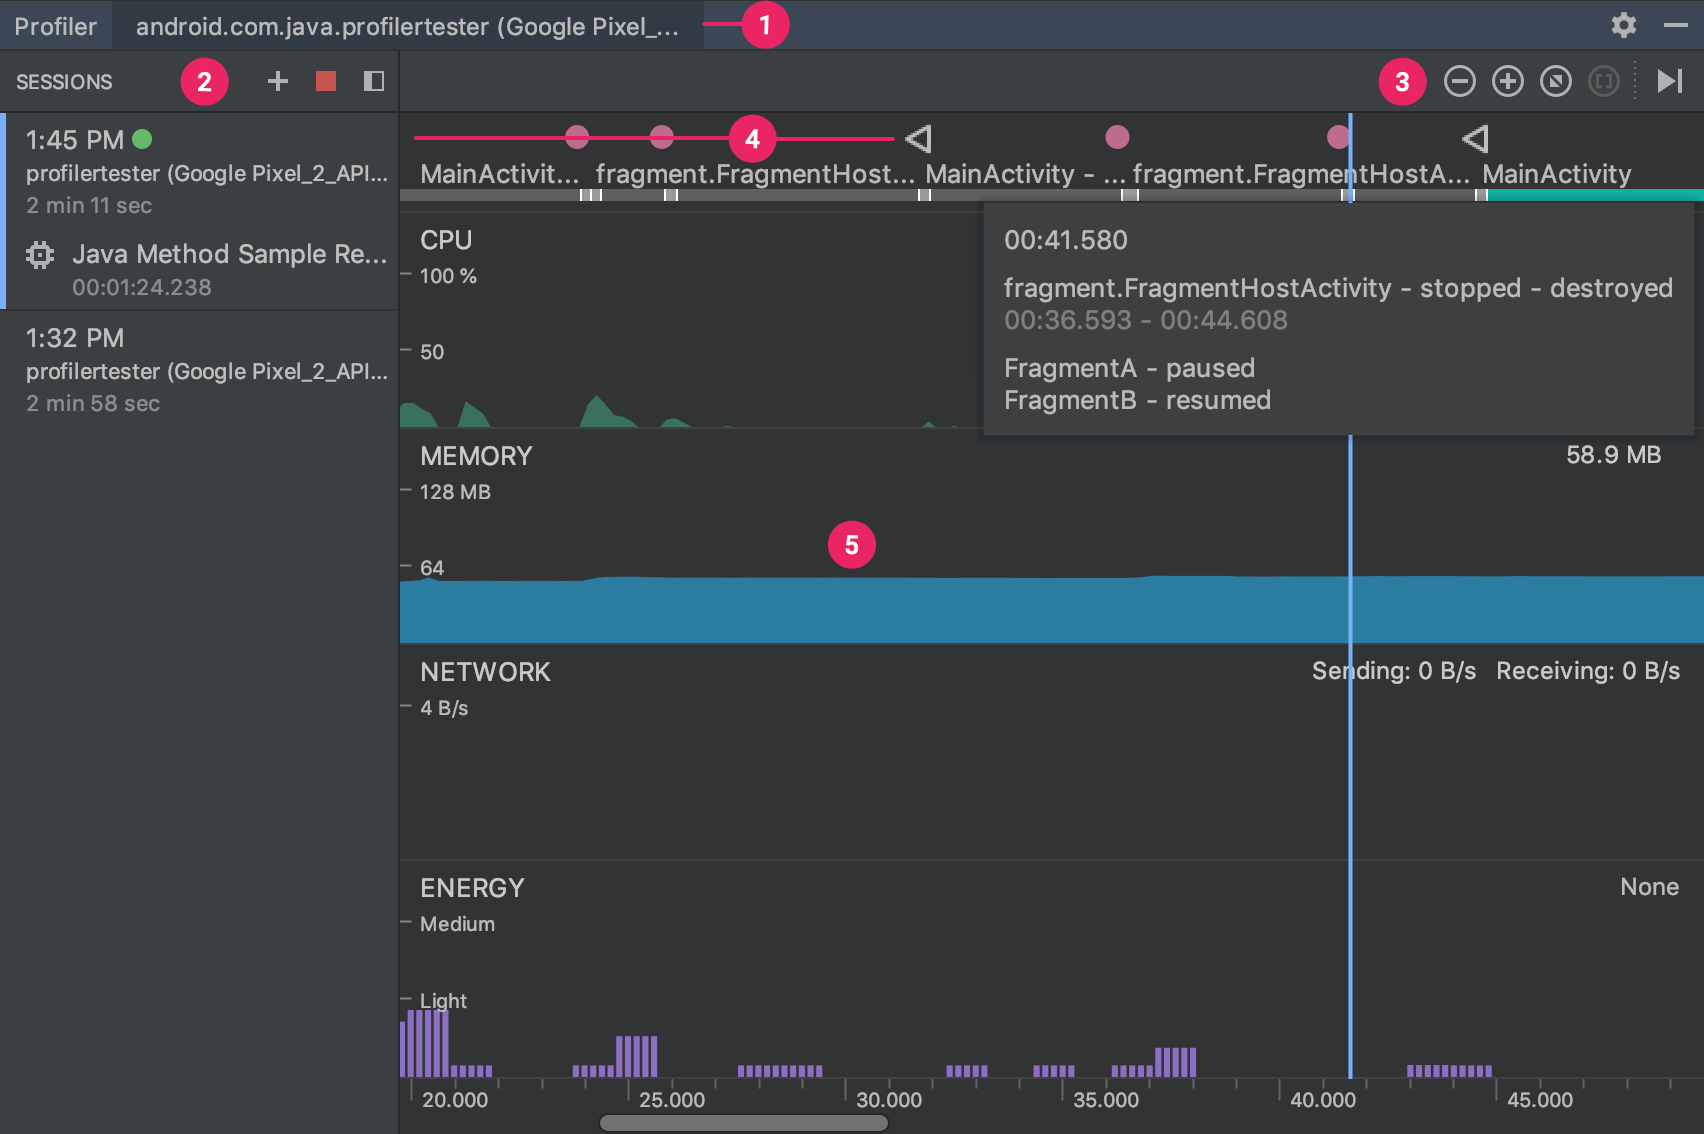
프로그램의 공간(메모리) 또는 시간 복잡성, 특정 명령의 사용 또는 빈도를 측정하는 동적 프로그램 분석(Dynamic program analysis)의 한 형태입니다. 모니터링과 달리 벤치마킹하는 데에 중점을 둡니다. 분산 환경보다 단일 애플리케이션을 배포하기 전 성능 테스트 및 계측에 쓰입니다.
더 읽을 거리
- CNCF Landscape - Observability 파트
- Observability | Wikipedia
- <마스터링 분산 추적> | 유리 슈쿠로
- <모니터링의 새로운 미래 관측 가능성> | 정현석, 진미란
- <BPF로 리눅스 관측 가능성 향상하기> | 데이비드 칼라베라, 로렌초 폰타나
- Metric
- Logging | Wikipedia
- Log management | Wikipedia
- Log analysis | Wikipedia
- Tracing | Wikipedia
- Monitoring
- Application performance management | Wikipedia
- System monitoring | Wikipedia
- Event monitoring | Wikipedia
- Network monitoring | Wikipedia
- Log monitor | Wikipedia
- Profiling | Wikipedia
-
<마스터링 분산 추적> 6쪽 | 유리 슈쿠로 ↩︎
-
한국어로는 다양하게 번역되는데 관측 가능성이 가장 많이 쓰이는 것 같습니다. (이 외에 관측성, 관찰성, 관찰 가능성, 가관측성) ↩︎
-
The Three Pillars of Observability: Logs, Metrics, and Traces | CrowdStrike ↩︎
-
<마스터링 분산 추적> 58쪽 | 유리 슈쿠로 ↩︎
최종 수정: 2025-04-09